
Naur - Purpose-driven software solutions

Ginseng Coverage Analysis: from protocol to billing grid in under 30 minutes.

Physician-developed, coverage-analyst-validated, AI used selectively, your team in control.

Built for oncology coverage analysis, including pediatric coverage analysis. More therapeutic areas coming soon.
Book a Demo

Or pilot Ginseng on up to 10 of your own protocols, so your team can see how it handles different study designs.

Ginseng Dashboard - Coverage Analysis Platform
Naur Monogram
Physician-developed
Analyst-validated
Your team decides
Pediatrics included

What Is Ginseng Coverage Analysis?

Ginseng Coverage Analysis is clinical trial coverage analysis software that takes a protocol — including its qualifying clinical trial (QCT) determination — to an audit-ready billing grid, grounded in NCD 310.1 Medicare coverage analysis rules, NCCN guidelines, FDA labels, MAC jurisdiction logic, eviCore and Children's Oncology Group (COG) guidelines.

15–50 days → under 30 minutes* (per site-reported benchmarks)

Typically 25–33% below the cost of outsourced coverage analysis, with the work kept in-house.

Includes: QCT, billing grid with justifications, amendment comparison, CPT and chargemaster codes, and pediatric protocols. Free for your institutional IITs.

Inside Ginseng

Built end-to-end for clinical research teams.

Product Walkthrough

See Ginseng Coverage Analysis in action.

A quick walkthrough of how Ginseng takes a protocol from upload to audit-ready billing grid.

Ginseng Coverage Analysis product walkthrough video
Dashboard

Every study, every status, in one place.

Track coverage analyses across review states with completion times, sponsors, and PIs at a glance.

Ginseng dashboard listing all studies and their review state
Secure access

Built for regulated environments.

Role-based access for PIs, QAMs and coverage analysts. Your protocols are never used to train models, and are deleted on your schedule.

Ginseng login screen with Naur branding
Add Study

Upload a protocol. Map page ranges. Done.

Guided steps capture protocol details, schedule of events, and objectives in minutes.

Ginseng Add Study flow capturing protocol details
Billing Grid

Audit-ready billing grid, automatically generated.

Sponsor (S), Routine costs (N) and Non-billable (NB) assignments per visit and assessment.

Ginseng billing grid with coverage assignments across visits

Configured with your chargemaster and CPT codes, and your institution's guidelines and risk tolerance, so every coverage analysis looks and reads like your own.

“It [CA billing grid output] looks just like our template. That's amazing.”

Director of Finance, NCI-Designated Cancer Center
The Manual Bottleneck

Coverage Analysis Shouldn't Be the Slowest Part of Trial Start-Up.

Every trial activation depends on a coverage analysis. When that analysis relies on manual cross-referencing, sites pay the price in lost time and audit risk.

15 to 50 Days

Manual Coverage Analysis Takes Weeks

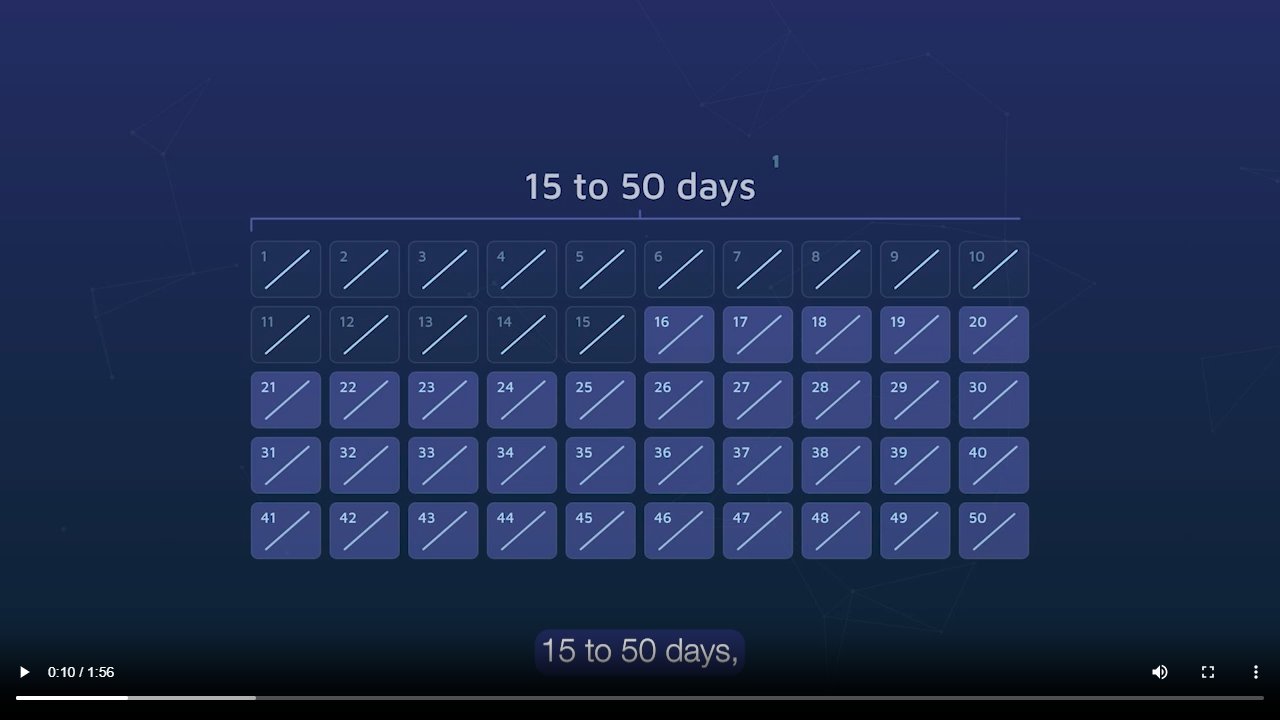
At benchmarked cancer centers, manually building a protocol's billing grid and coverage determination takes 15 to 50 days — time the trial spends waiting before it can activate.

Per site-reported benchmarks.

Outsourcing Isn't Cheap

Vendors Don't Remove the Bottleneck

Many sites outsource coverage analysis to third parties at a premium, study after study — without actually shortening the timeline or keeping the work in-house.

Fragmented & Hard to Audit

Spreadsheets, Email Chains, Judgment Calls

Cross-referencing NCD 310.1, NCCN guidelines, FDA labels, MAC jurisdiction logic, eviCore and COG guidelines by hand leaves a trail that's difficult to defend during an audit — putting research billing compliance at risk.

How Ginseng works

From protocol to billing grid, in four steps.

Coverage analysis automation that still puts every determination in front of your team before it's final.

STEP 01

Add Study

Upload a Protocol. Map the Schedule of Events. Done.

Guided steps capture protocol details, the schedule of events, and study objectives in minutes — no blank templates, no re-keying data your team already has.

Ginseng Add Study flow capturing protocol details
STEP 02

Physician-Developed Rules Engine

Every Procedure, Checked Against the Guidelines That Matter.

Ginseng cross-references each visit and assessment against NCD 310.1, NCCN guidelines, FDA drug labels, MAC jurisdiction logic, eviCore imaging and Children's Oncology Group (COG) guidelines — calibrated to your institution's risk tolerance.

Guideline matchingCycle 1, Day 1 visit
  • NCCN GuidelinesSponsor (S)
  • NCD 310.1Routine cost (N)
  • FDA drug labelSponsor (S)
  • eviCore imagingNon-billable (NB)

Illustrative preview — calibrated to institutional risk tolerance.

STEP 03

Billing Grid

An Audit-Ready Billing Grid, Generated Automatically.

Sponsor (S), routine cost (N), and non-billable (NB) assignments per visit and assessment, with justifications attached, ready for budgeting and sponsor negotiation.

Ginseng billing grid with coverage assignments across visits
STEP 04

Dashboard & Secure Access

Every Study, Every Status, in One Place.

Track coverage analyses across review states with completion times, sponsors and PIs at a glance. Role-based access for PIs, QAMs and coverage analysts — your protocols are never used to train models, and are deleted on your schedule.

Ginseng dashboard listing all studies and their review state
Manual process vs. Ginseng

Same coverage analysis. A fraction of the time.

Bring coverage analysis in-house, without the hiring challenge. Ginseng Coverage Analysis is a force multiplier for your team, not a replacement.

Comparison of the traditional manual coverage analysis process with Ginseng
Operational DimensionTraditional Manual MethodWith Ginseng
Coverage Analysis Turnaround15 to 50 days per protocolUnder 30 minutes
CostOutsourced vendors, ad hoc pricing per studyTypically 25–33% below outsourced CA cost
Guideline GroundingJudgment calls, analyst by analystNCD 310.1, NCCN, FDA labels, eviCore, COG guidelines
Audit TrailScattered spreadsheets and email chainsAudit-ready billing grid with justifications
Time-to-ActivationCoverage analysis bottlenecks study start-upFrees up weeks for faster trial activation

* Per site-reported benchmarks. Savings depend on volume, contract length and program specifics.

What research teams are saying

Feedback from our pilot programs.

I would happily do this [Ginseng CA Process] 20 times rather than spend hours on the same CA in our current system [process].

MCA & Budget Analyst

NCI-Designated Clinical Cancer Center

This [Ginseng] looks much more implementable [compared to other systems]. Once we have the institutional specifics [guidelines and risk tolerance] configured [in Ginseng], we'll have a really impactful product for CA.

Senior Director

Clinical Trials Office, NCI-Designated Comprehensive Cancer Center

It [CA billing grid output] looks just like our template. That's amazing.

Director of Finance

NCI-Designated Cancer Center

See your own numbers

How much would Ginseng save your site?

Answer a few questions about your study volume and current process to see the time and cost impact, side by side with your current workflow.

ROI CalculatorGinseng Coverage AnalysisOpen full screen

See Your Billing Grid in Under 30 Minutes.

Bring a protocol and watch Ginseng turn it into an audit-ready billing grid, live.

Free for institutional investigator-initiated trials (IITs), because we want to promote clinical research.